

Process monitor
Status: ✅ Implemented
Intent
Section titled “Intent”Answer “are the automations healthy?” in one glance — each integration/robot as a row with a health dot, the systems it touches, its OK/warning/error counters — and put the fix one click away when something needs attention.
Solution
Section titled “Solution”Use the ProcessMonitor component: a list of ProcessItems. Each row shows a colored status dot (ok | warning | error), the process name with its systems joined · in muted small text below, right-aligned counters (✓ 847 OK always; ⚠ warnings and ⛔ errors only when greater than zero) and, when actionLabel + actionId are present, a small warning-styled button.
@Section("Automatizaciones")Component monitor = ProcessMonitor.builder() .items(List.of( ProcessItem.builder().id("credit").name("Facturación a Crédito") .systems(List.of("OHIP", "OIC", "Voxel")) .ok(847).warnings(6).errors(0).status("warning") .actionLabel("Solucionar").actionId("fixCredit").build(), ProcessItem.builder().id("sales").name("Comercializadora") .systems(List.of("OHIP", "ERP Fusion A/R")) .ok(418).warnings(0).errors(0).status("ok").build())) .build();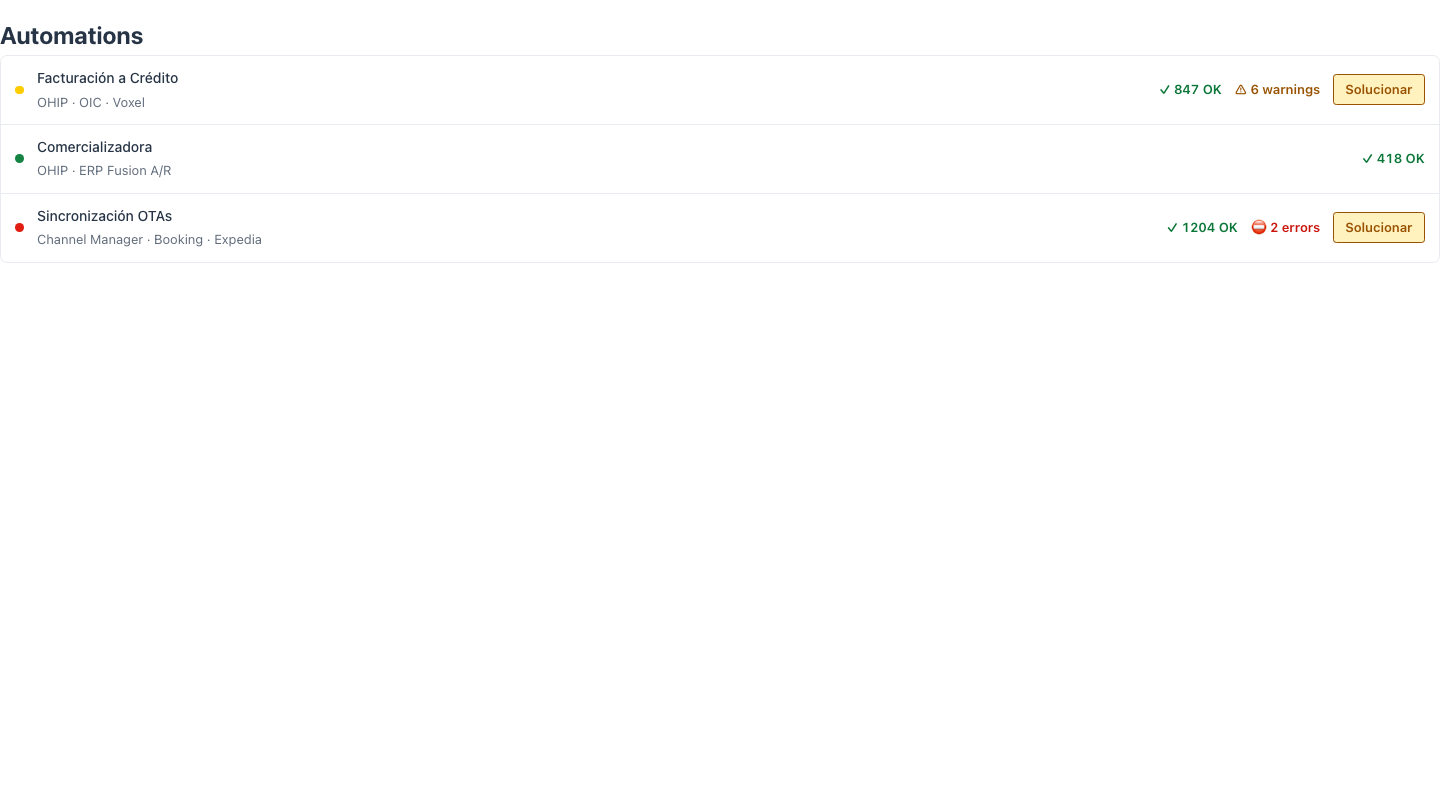
The fix button dispatches the standard action-requested event with the item’s actionId and no parameters — each process points at its own remediation action (open the failed batch, retry, navigate to the detail).
When to use it
Section titled “When to use it”Use a ProcessMonitor on operations/health screens — nightly interfaces, billing robots, channel synchronizations — where each row is a process, not a data record. For numeric KPIs and drill-in tiles use a Dashboard (it composes well as a dashboard panel); to narrate one process’s events over time use a Timeline. See it composed into a whole screen in Front-office screens. Demo: /process-monitor-demo.