

Heatmap (calendar)
Status: ✅ Implemented
Intent
Section titled “Intent”Show how much happened when over a long stretch of days — commit activity, usage, occupancy, sales — as a calendar heatmap, so streaks, gaps and busy periods pop out at a glance.
Solution
Section titled “Solution”Use the Heatmap component: one HeatCell per day with a date and a value. The renderer lays the days out in week-columns (Monday-first) and colors each square by intensity from 0 to the maximum value. label overrides the cell tooltip.
@Section("Commits this year")Component heatmap = Heatmap.builder() .cells(List.of( HeatCell.builder().date(LocalDate.of(2026, 3, 1)).value(2).build(), HeatCell.builder().date(LocalDate.of(2026, 3, 2)).value(5).label("5 commits").build() /* … one per day … */)) .build();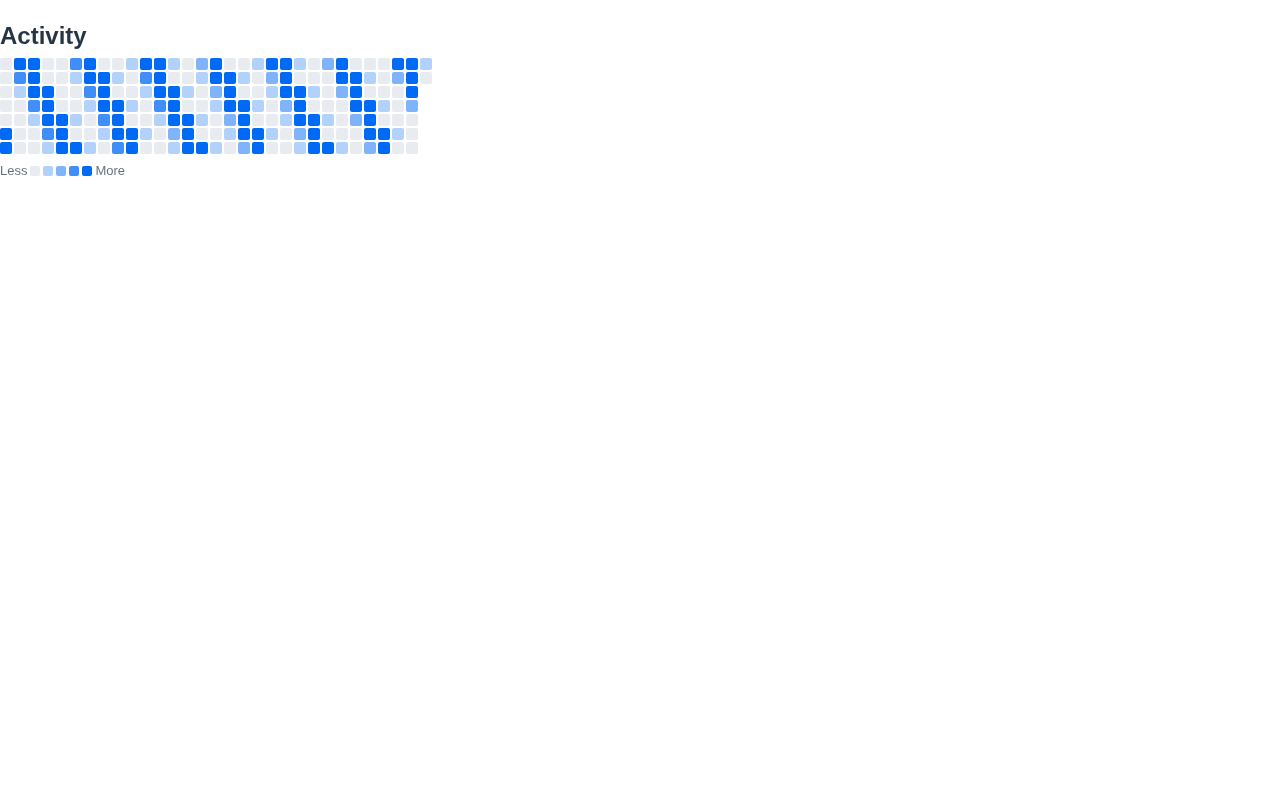
The renderer is dependency-free (a CSS grid of squares), colors by four intensity buckets of the primary color, themes through the standard CSS variables, works in dark mode, scrolls horizontally when wide and shows a Less→More legend. On mobile (React Native) and the IntelliJ plugin the same values render as a compact grid.
When to use it
Section titled “When to use it”Use a Heatmap for intensity across many days. For a handful of dated events use a Calendar; for a trend line use a TrendChart or Stat sparkline. Demo: /heatmap-demo.