

Gantt / timeline
Status: ✅ Implemented
Intent
Section titled “Intent”Show time-based work — a project plan, a shift schedule, a rollout — as bars on a shared time axis, so overlaps, gaps and progress are visible at a glance.
Solution
Section titled “Solution”Use the Gantt component: one GanttTask per row, with a date span, optional progress (rendered as a fill inside the bar) and optional color. The component derives the axis from the tasks’ dates, draws month headers and marks today with a vertical line.
@Section("Schedule")Component plan = Gantt.builder() .tasks(List.of( GanttTask.builder().title("Discovery & research") .start(LocalDate.of(2026, 6, 1)).end(LocalDate.of(2026, 6, 12)) .progress(100).build(), GanttTask.builder().title("Implementation") .start(LocalDate.of(2026, 7, 1)).end(LocalDate.of(2026, 8, 14)) .progress(25).build(), GanttTask.builder().title("QA & launch") .start(LocalDate.of(2026, 8, 17)).end(LocalDate.of(2026, 8, 31)) .color("#10b981").build())) .build();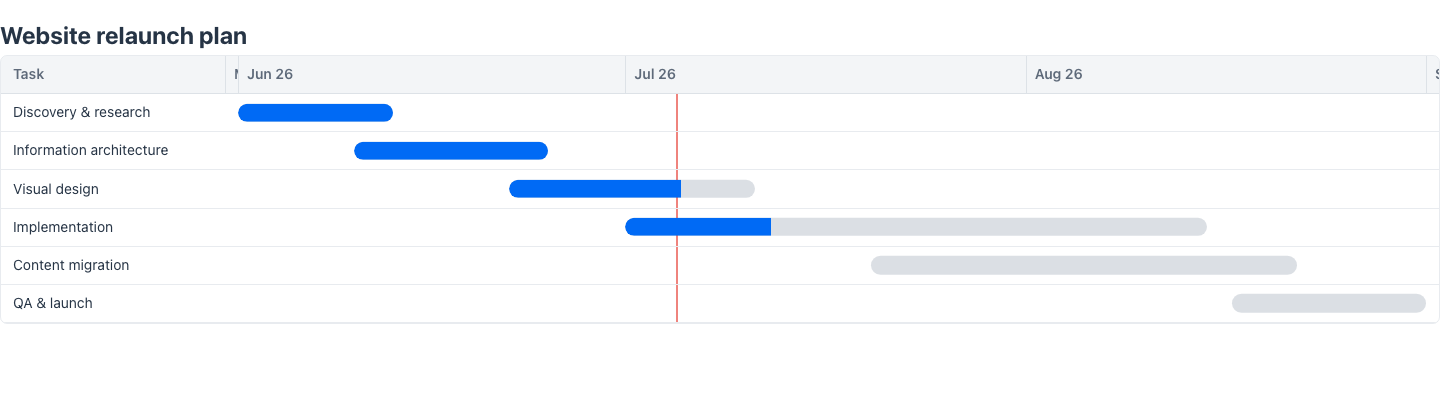
The renderer is dependency-free (plain CSS grid), themes through the standard CSS variables, and works in dark mode. Hovering a bar shows the task’s dates and progress.
When to use it
Section titled “When to use it”Use a Gantt to monitor schedules and communicate plans. It is read-only by design in this version — for interactive re-planning (dragging bars, dependencies), pair it with a form or CRUD that edits the underlying tasks and re-renders.
Gantt page template (GanttPage archetype)
Section titled “Gantt page template (GanttPage archetype)”For a full-page scheduling canvas — the Redwood Gantt page template — extend GanttPage
instead of embedding a Gantt in a form. Implement tasks(rq) to supply the bars; the page lays
the canvas out edge to edge (it declares PageWidthStyle.EDGE_TO_EDGE), and an optional
detail(rq) docks any component (a table, a card) below the canvas as the Redwood bottom panel:
@UI("/gantt-page-demo")@Title("Project plan")public class ProjectPlanPage extends GanttPage { @Override protected List<GanttTask> tasks(HttpRequest rq) { return schedule(); } @Override protected Component detail(HttpRequest rq) { return summaryTable(); }}It is pure composition of existing components (Gantt + VerticalLayout + Card), so it renders on
every renderer without renderer work. Demo: /gantt-page-demo. Interactive task selection (click a
bar → side/bottom drawer with the task detail) and the .NET/Python GanttPage ports are planned
follow-ups.